 Vietnam Seaports Association

(VPA) – The Vietnam Seaports Association (VPA) has released its October 2026 container throughput report. It is the first report in VPA’s new format: clear visual charts in Vietnamese and English, with analysis by port cluster and cargo type shared with Member Ports.
Highest monthly volume this year
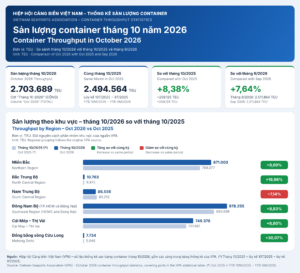
According to VPA statistics, container throughput at ports in the VPA statistical table reached 2,703,689 TEU in October 2026. This was up 8.38% (+209,125 TEU) from October 2025 and up 7.64% (+191,825 TEU) from September 2026, the highest monthly level in the first ten months of 2026.
Cumulative throughput for the first ten months of 2026 exceeded 24.4 million TEU, up 9.2% year on year.
Five of six regions grew
| Region | Oct 2026 (TEU) | vs Oct 2025 | Share |
|---|---|---|---|
| Southeast Region (HCMC and Dong Nai) | 978,255 | +9.83% | 36.2% |
| Northern Region | 871,003 | +9.69% | 32.2% |
| Cai Mep – Thi Vai | 749,378 | +6.80% | 27.7% |
| South Central Region | 86,556 | −7.14% | 3.2% |
| North Central Region | 10,763 | +19.96% | 0.4% |
| Mekong Delta | 7,734 | +30.07% | 0.3% |
| Total | 2,703,689 | +8.38% | 100% |
The Mekong Delta (+30.07%) and the North Central Region (+19.96%) posted the fastest growth, though from small volumes. The South Central Region was the only region to decline (−7.14%). The Southeast Region and Cai Mep – Thi Vai together accounted for 63.9% of October throughput; the Northern Region accounted for 32.2%.
Deep-water clusters drive growth
The deep-water clusters of Cai Mep – Thi Vai and Lach Huyen handled 1.09 million TEU in October 2026. That was 40% of total throughput and about three quarters of the year-on-year increase.
Over the first ten months, the two clusters accounted for 39% of throughput and almost 69% of the increase.
Detailed reports for Member Ports
Alongside this release, VPA has shared detailed reports with its Member Ports. These include the cargo-type mix (import, export, domestic, transshipment) and a separate report for each port cluster, with monthly and year-to-date figures for the ports in that cluster.
👉 View the October 2026 report: HERE
Notes: Figures are compiled from VPA’s container throughput statistics and cover ports in the VPA statistical table. Unit: TEU. Regional grouping follows the VPA source, with Cai Mep – Thi Vai reported separately. October 2025 = YTD 10M/2025 − YTD 9M/2025. Growth = (current period / comparison period − 1) × 100%. The Lach Huyen cluster comprises HICT, HTIT and HHIT.
Source: Vietnam Seaports Association (VPA)